
Sonifying spike activity of magic mushrooms

Hello guys,
i have created a max patch that transforms voltage difference graphs of the mycelium into sound waves using coll, buffer~, and poke~.
The metro of the patch is dependent on the spike activity found in a graph. i have a graph of the electrical signals happening in mycelium and using MATLAB, i denoised the graph using morse wavelet transform.
this is the denoised graph as a txt file. i am using coll to read out the file and plot it using multislider.
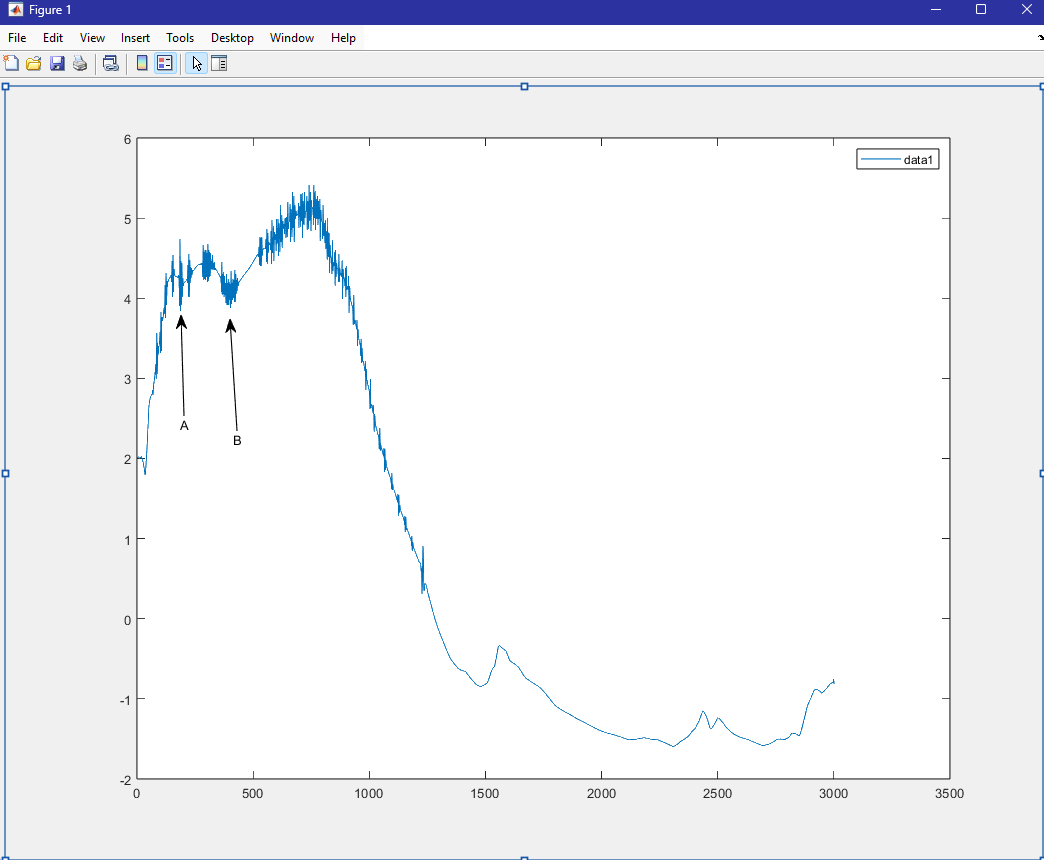
the image shows the graph after denoising and you can see there are spike activities happening in A and B. is there for max to detect these activities and then that would change the value of metro making it faster.
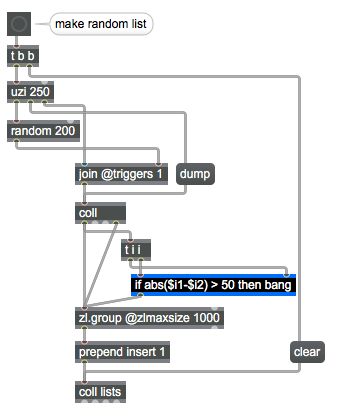
this is a small portion of my patch. is there a way for max to detect these sudden changes happening compared to the smoothness of the rest of the graph. maybe using integral to find slope or something.
Thank for the help,
Hicham

if abs current value - previous value > then threshold, then = spike ?
in case that is what a spike means to you.
value could be average of 10 readings or any other criteria.
hey @sourceaudio,
thanks for the reply, I found a way in python to detect sudden changes happening using a threshold of 0.12. I now have a list of the X values in which the sudden changes happen.
do you know how I can split the list depending on the difference between the values? if the difference is more than 50 then split the list into a separate list but if the difference is less keep them in the same list.
example: 81
82
83
84
85
86
98
99
100
101
102
103
104
117
118
119
120
121
122
123
124
126
148
149
150
151
152
153
154
156
179
180
181
182
183
184
185
186
187
188
189
190
191
192
194
216
217
218
219
220
221
222
223
224
226
228
281
282
283
284
I want max to check the difference between each value and if its more than 50 split the list, so here it should give me a list from 81 to 228 and then another list from 281 to 284
thanks for the help
your list is sorted ? that can not be, or ?
if you compare again if new value is more than 50 different from previous one,
close collecting of so far collected values and start new collection,
which can be done using zl.group, append etc.
lines can be inserted into new text line, coll line .... anything.
but why do you need so many different softwares to perform one task ?
collected data into matlab, matlab to python, python list to max ...
That is awesome, thanks ive been banging my head for a while for this hahaha. I'll try it out now.
Well i used matlab to do data analysis using morse wavelet transform and spline interpolation to denoise the data and allow me to detect spike regions which i think max cannot do. Then i used python to analyze the denoise graph and check for sudden changes happening with a threshold of 0.12, i didnt know how to do it on matlab. Then the list of indices in which the sudden changes happened had to be split to compare for a difference of 50 since a spike activity will never be shorter than 50 seconds according to research done on mycelium (each sample is one second) and then whenever a spike is detected this will change the speed of the metro object which plays out a buffer object that has sound waves created by the mycelium itself using poke to write and store the samples.