
New Package: [spectrogram~] available via Package Manager

Hi all,
I'm very excited to announce the spectrogram~ object suite, available via the Max 8/9 Package Manager.
[spectrogram~] is a [buffer~] based spectral analyzer that brings interactive frequency-domain visualization to Max.
With support for multiple window functions, perceptual frequency scales (Lin, Log, Mel, Bark, ERB), customizable color schemes, and mouse-driven zoom/pan/selection, [spectrogram~] provides flexible visual feedback and real-time control for spectral analysis, sound design, and interactive audio applications.
Additional tools included in this package:
[spectrogram.colorbar] - a UI external that displays magnitude-to-color mappings for an attached [spectrogram~] object.
[spectrogram.bandpass] - a frequency domain bandpass abstraction that can be controlled by the [spectrogram~] object.
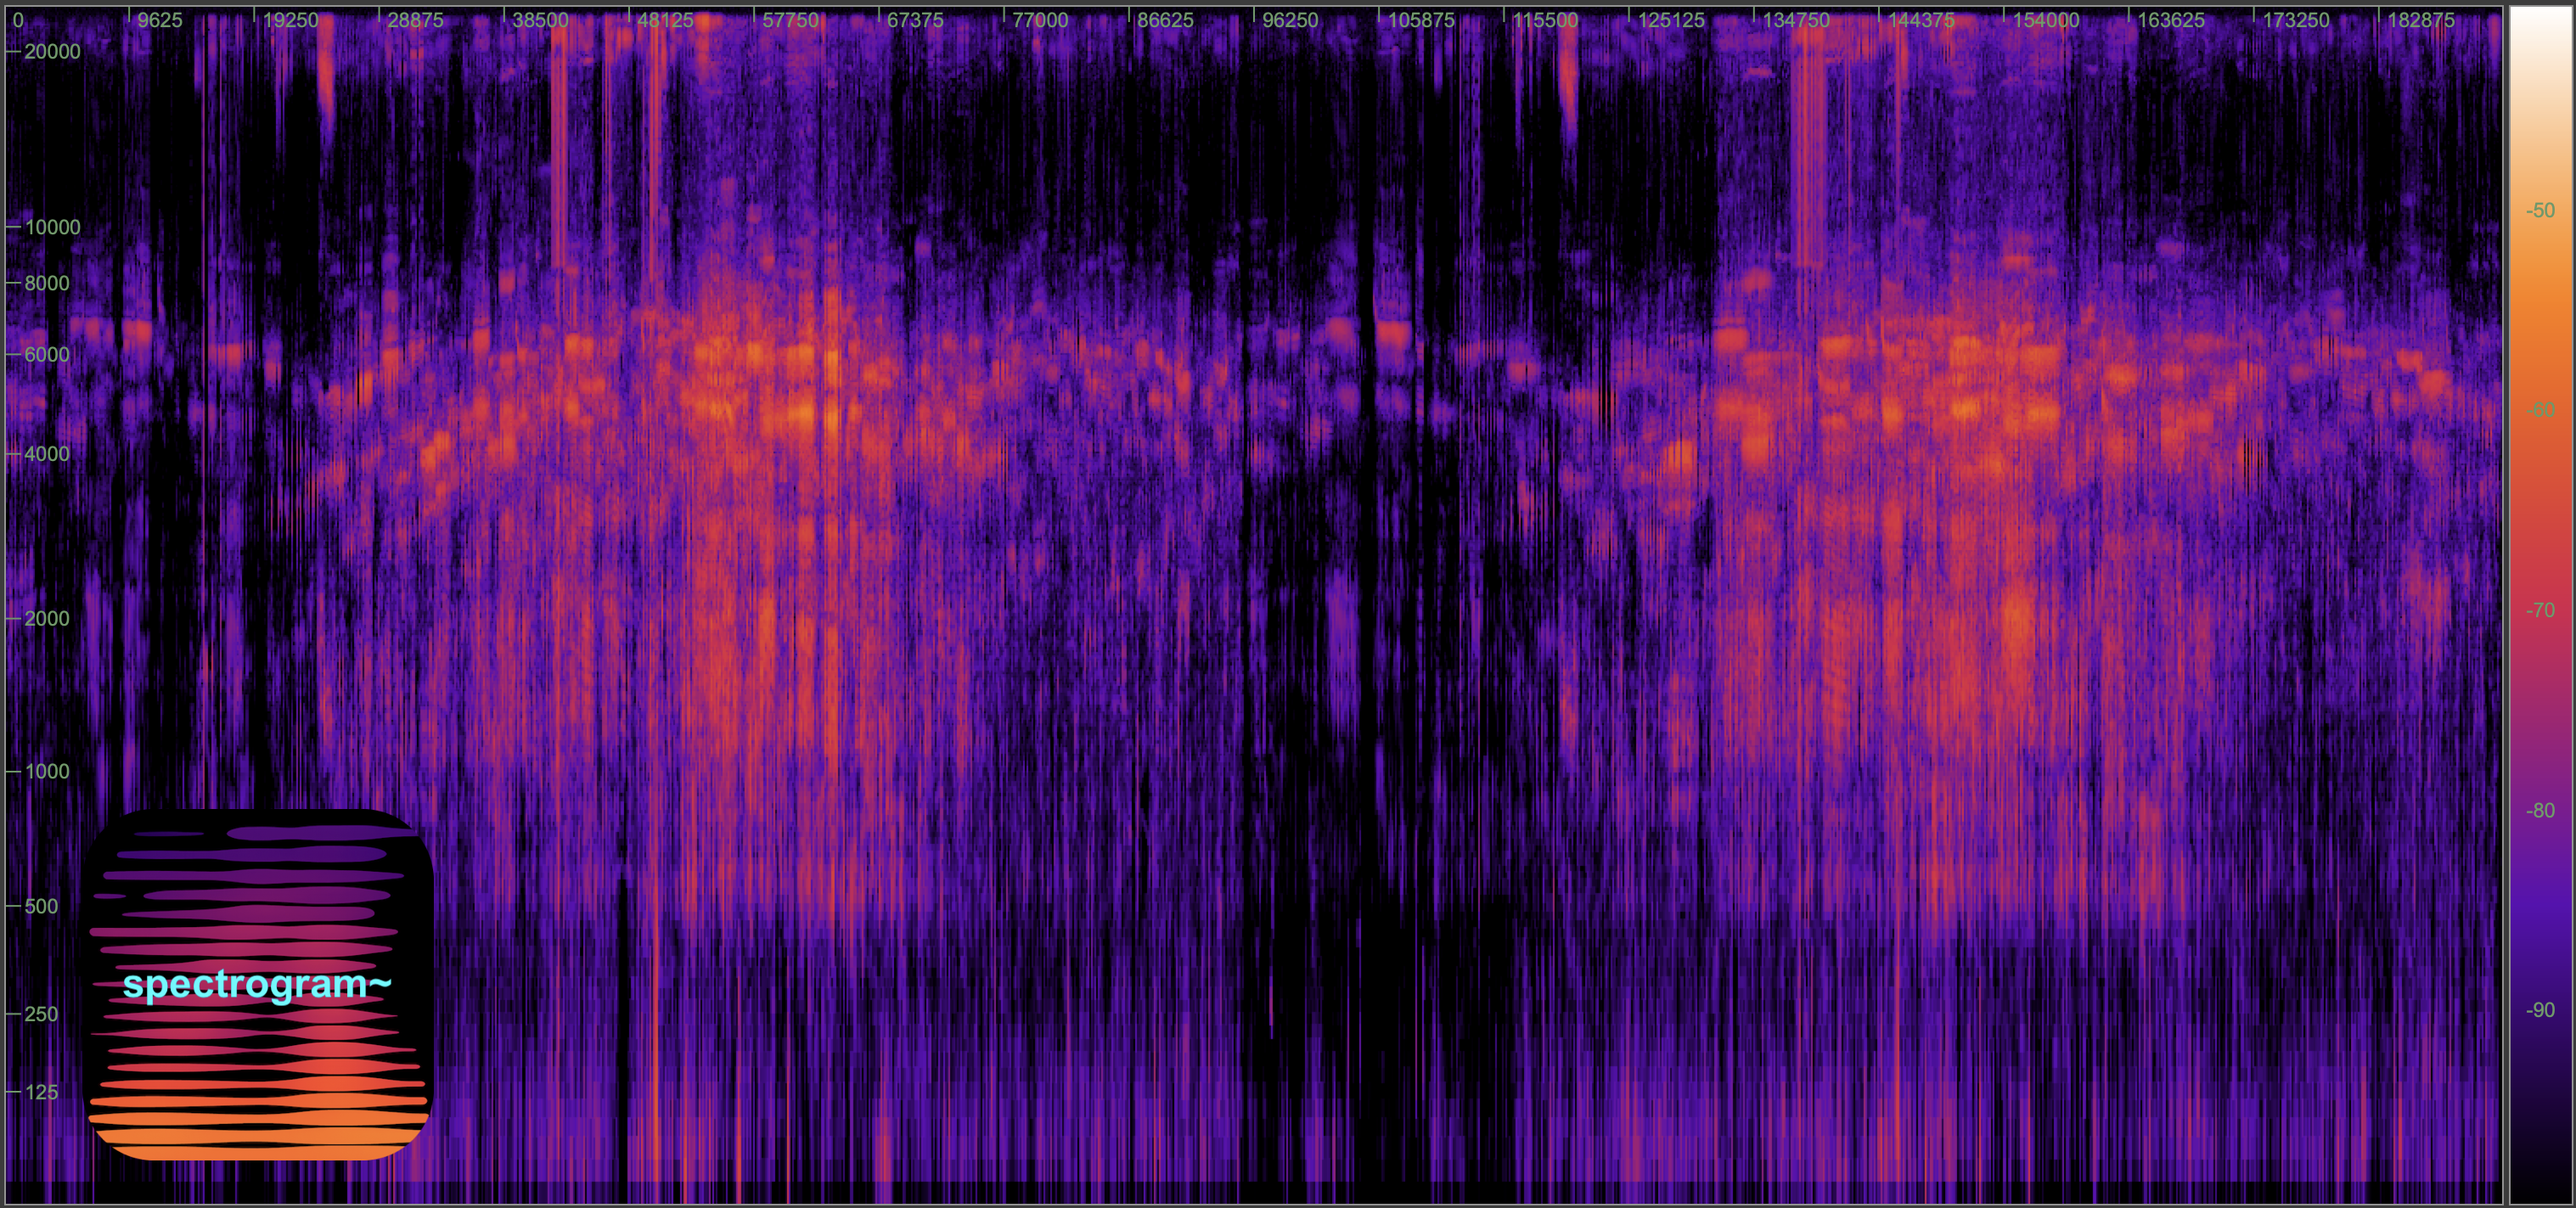
These tools grow out of ongoing collaboration with the very talented Lei Liang (UCSD, Qualcomm Institute) and Joshua Jones (Scripps Oceanography), working with (among other material) high resolution underwater recordings (the above image is one such example... of Beluga whales).
Aside from the visual/analytic functionality provided by the external, from a UX perspective you can think of [spectrogram~] as a frequency domain version of the [waveform~] object. But with [spectrogram~] you have two axes to zoom/pan/loop, etc. (time AND frequency)! A good starting point for all this is the overview patch (Extras -> spectrogram~ Overview), which links to the reference docs, help patches, and youtube playlist.
The help patches attempt to walk you through all important functionality step by step, so be sure to look there if interested.
Snippets are also included that provide easy starters for your patching (including dynamically resizable spectrogram~ example).
I think many of you will really enjoy this. I certainly wanted this capability available in Max! Please let me know how you use it, and send any comments/questions my way.
Best,
Zachary