Monitoring Multichannel signal

Hi,
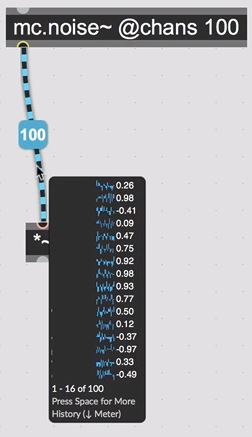
wich is the best way to "visualize" a multichannel signal for monitoring purpose? The simultaneous visualization of all the channels separately like in the History monitor (in photo). Something clear like a live.scope would be the best.
The only object that i found is mc.scope~, but i didn't found a way to visualize the channels separately: appearently seem that the only visualization possible is the simultaneous overlapping of the channels.
I think that i'm missing something, any help would be appreciated.
I tryed to search on the forum but i found almost nothing exept one old post, from where i took the picture.
Thanks,
G

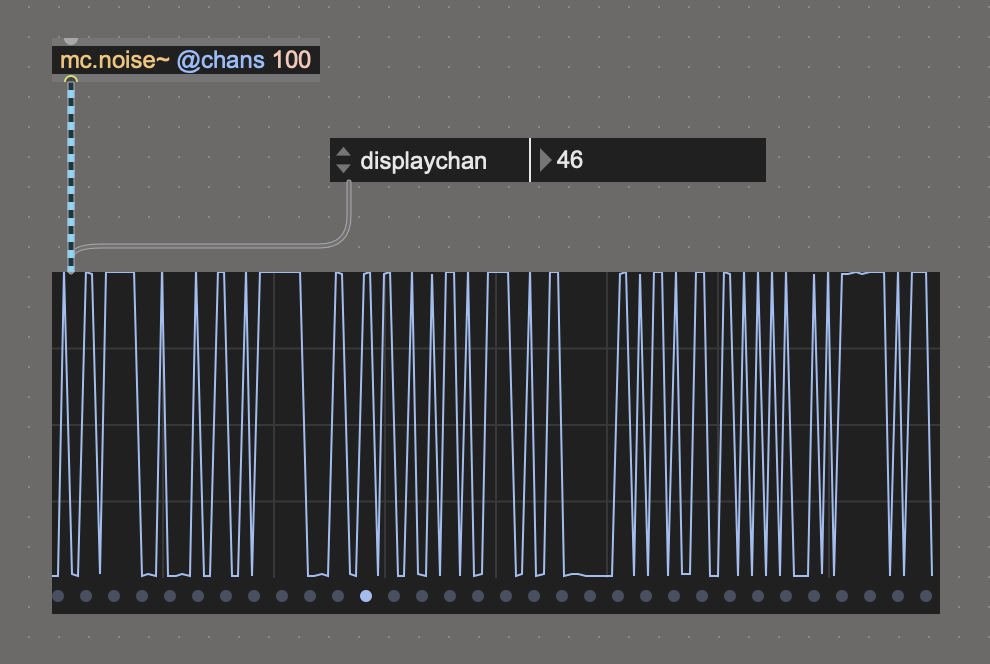
[mc.scope] + (displaychan) ?
Hi Sébastien,
thanks for your replay. The displaychan attribute is very useful, but still don't allow the simultaneous visualization of all the channels (or at least a part of them toghether). I'm searching for an object that does the work of the multichannel "meter" (the one that pop up when your cursor step by a multichannel cable) .

mc.meter~ ? maybe is what you are looking for.

if you just need to check modulation across all channels, gridmeter~ might be useful.
I wasn't thinking about mc.meter~, thanks! But still aswer just half of the question (like mc.scope~ but in the other way): simultaneous visualization, but almost no rapresentation of the signal (like live.scope). At least the levels, but i would like to see graphically the floating from 0 to 1 (or other) over time.
Florian thanks for the answer, but i find a bit difficult to understand the meaning of gridmeter~, that i didn't know, but i think it offer overlapping view like the mc.scope~, and just the levels or something similar.
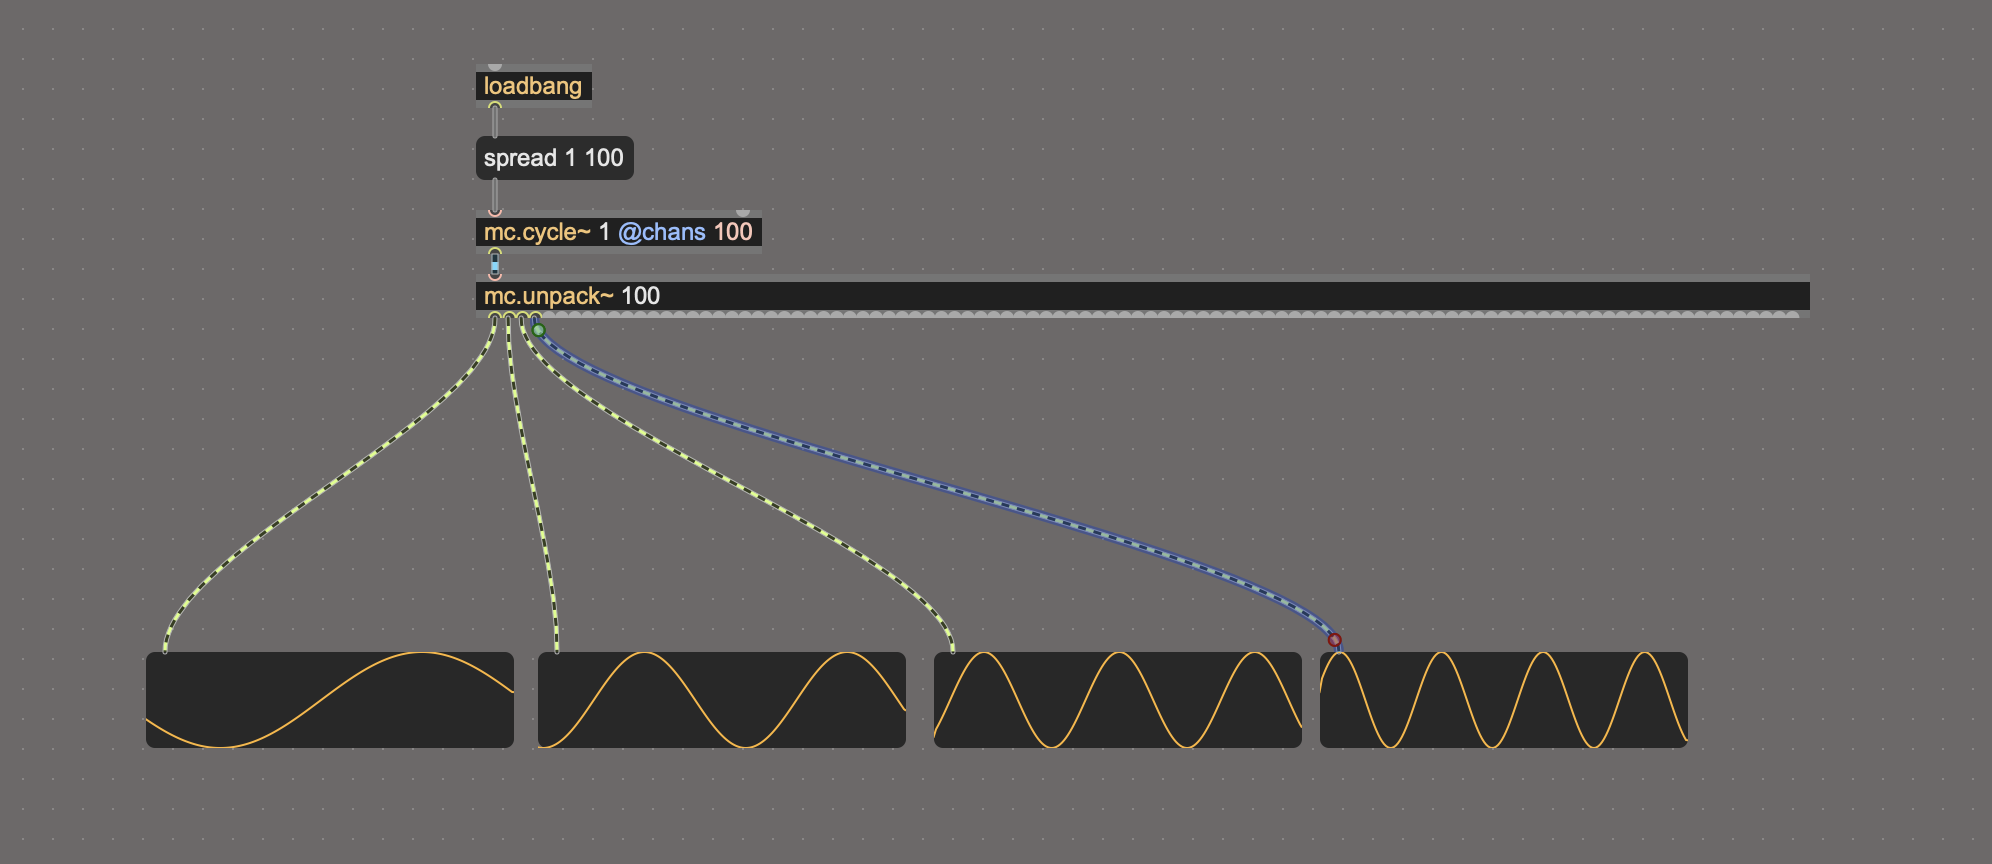
You can also un-pack the mc cable. Though quite heavy for @chans 100 ;-)