The JavaScript-mtr Connection, Part 2
In the first part of this series, we introduced using JavaScript to take advantage of the new dump dictionary available with the Max multitrack recorder object, mtr. We learned how to import a JavaScript library called mtr-accessor, how the data in mtr-accessor is structured, and how we could perform basic operations on the data.
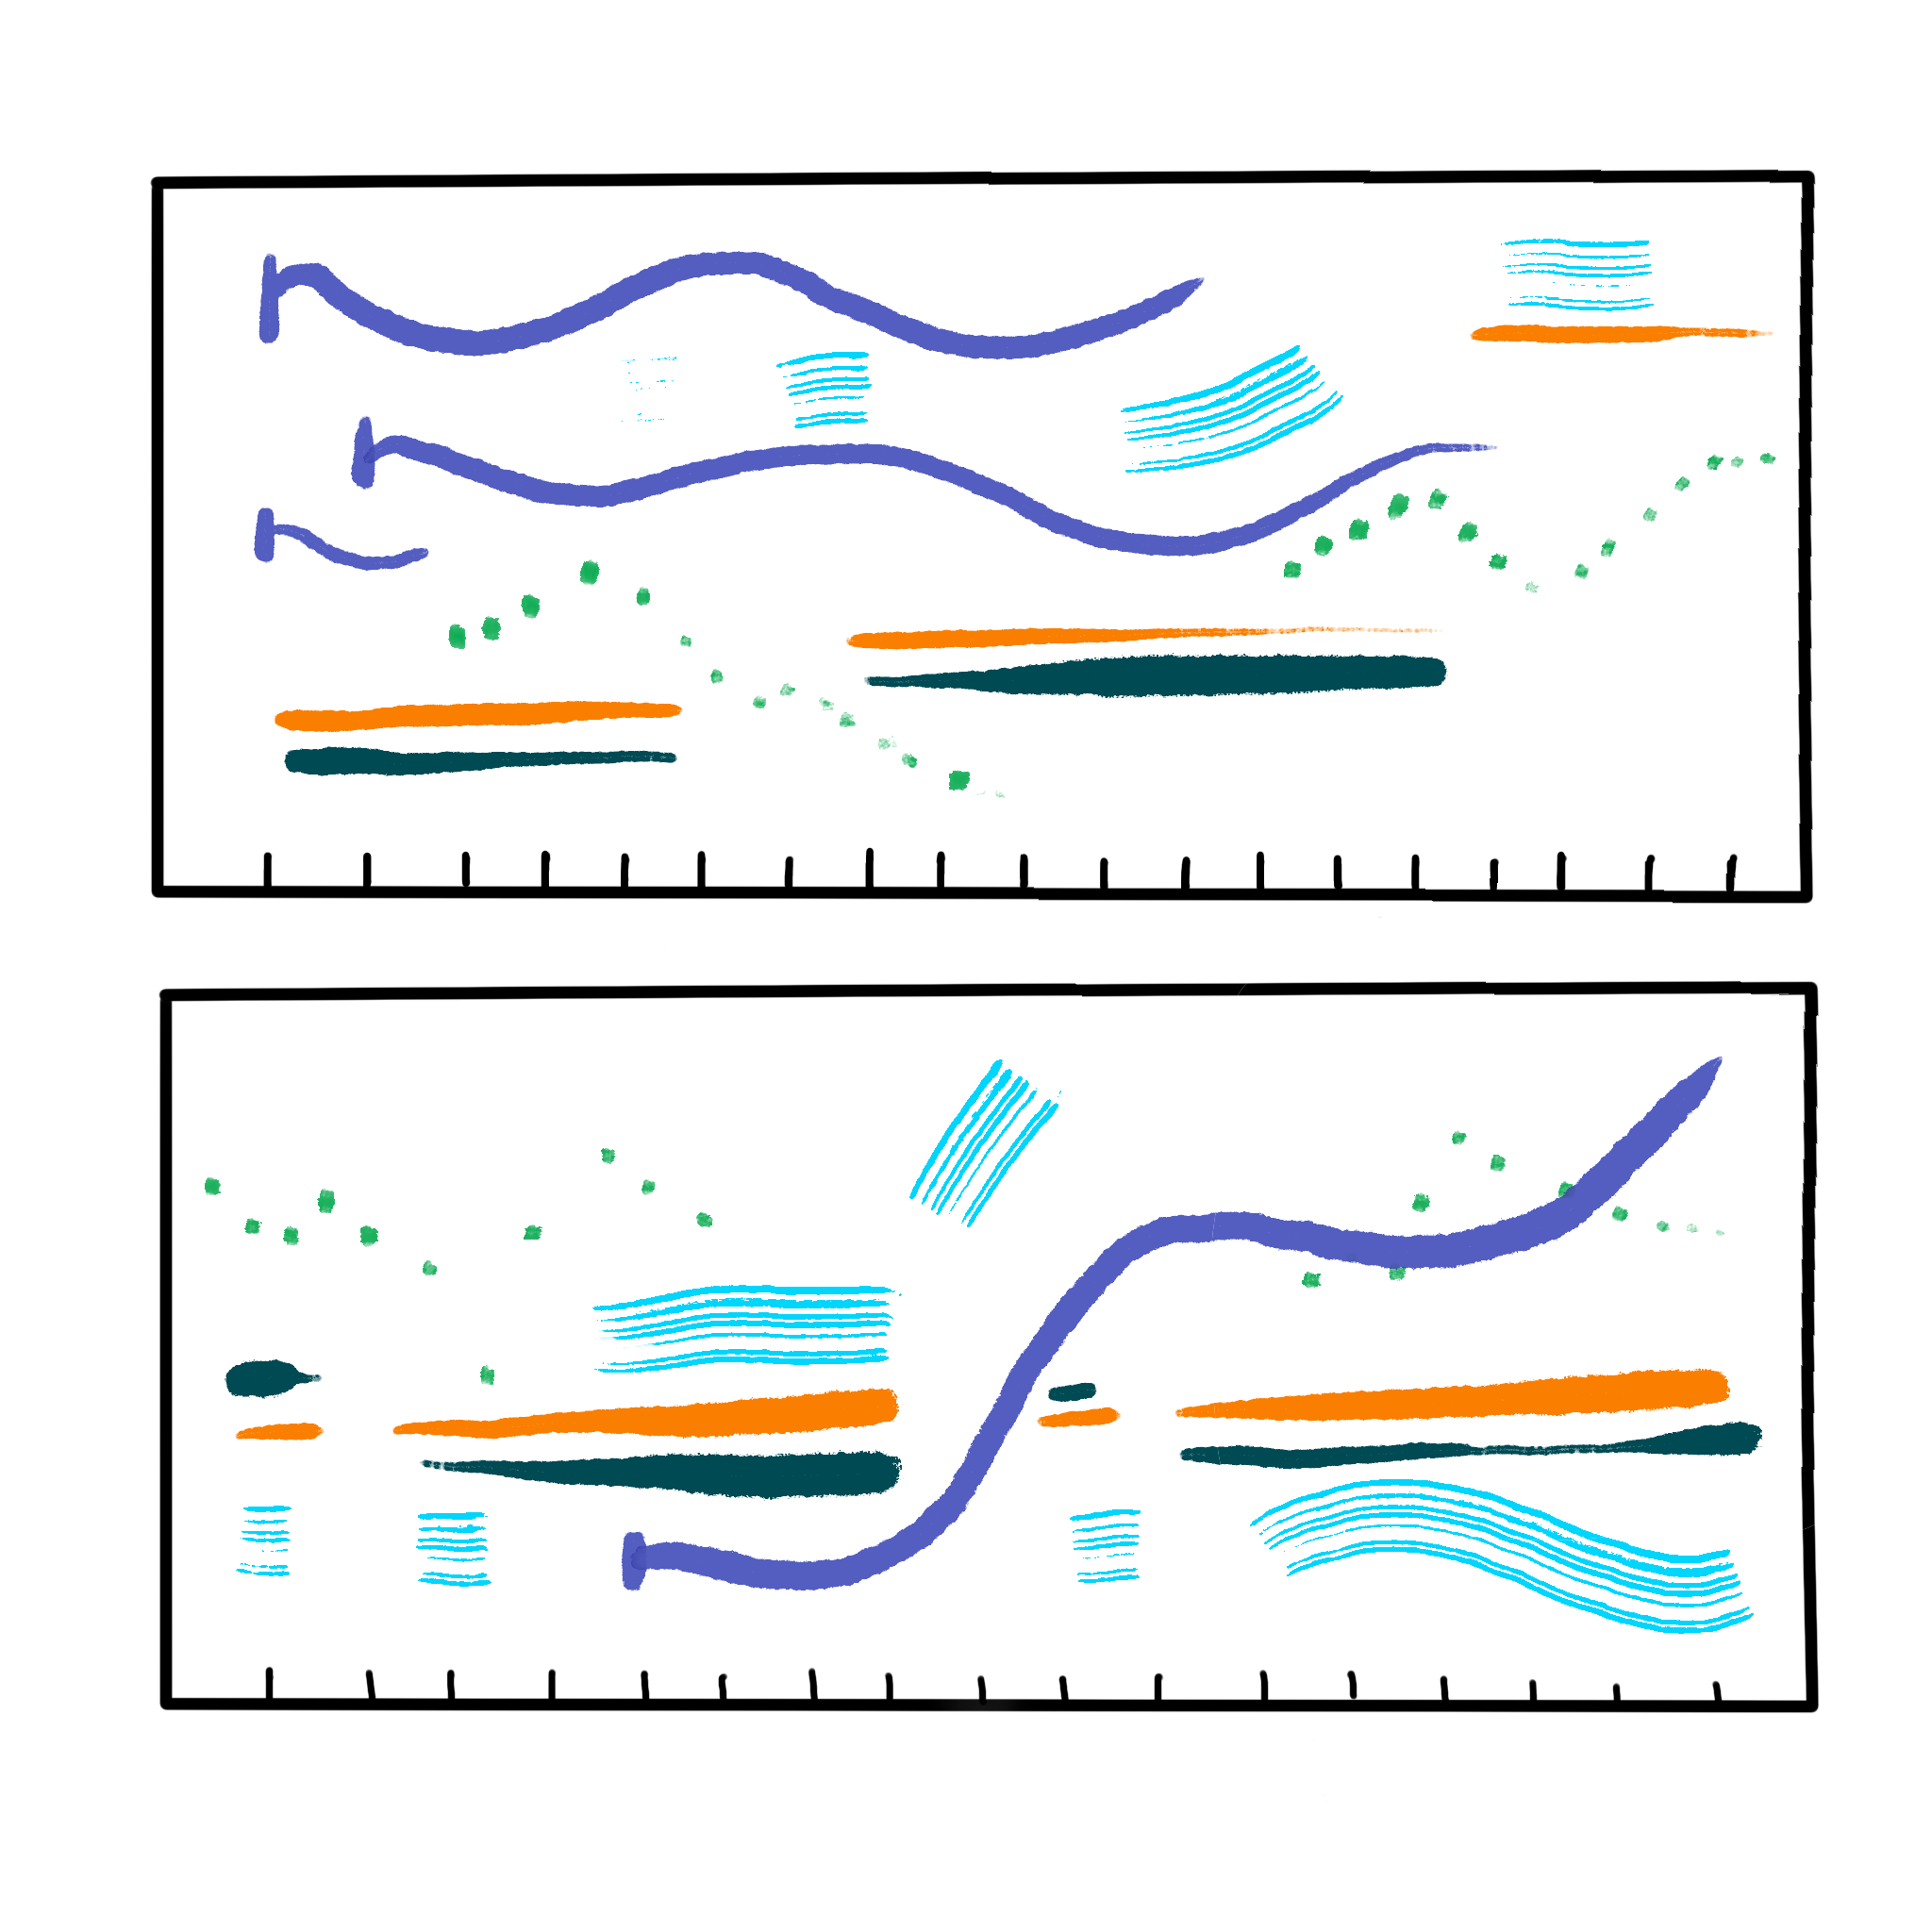
The goal of Part 2 of this tutorial is to create a graphical score for our mtr data using the jsui object. Taking inspiration from experimental music notation, we’ll plot data left to right, using different colors, shapes, and vertical positions to represent mtr data.

In this tutorial, we’ll touch on:
Where to get started with jsui and the mgraphics system
How we can represent different data types (numbers, arrays, and strings)
How to implement our graphical score in JavaScript
Getting started with jsui and mgraphics
For JavaScript graphics in Max, we can use the jsui object. You may find the tutorial “Designing User Interfaces in JavaScript” helpful if you are new to JavaScript and JavaScript graphics in Max. In addition, you may want to bookmark the MGraphics Quick Start Guide as a documentation reference. Of course, the jsui help patcher also provides many examples to give you a taste of what you can do with JavaScript visualizations in Max!
Representing different data types
We need to consider that the mtr object can hold more than numbers. (Arrays and strings are fair game!)
Numbers: These are straightforward; we can use the numerical value as the y-position.
Arrays: We can draw a box where the height is the length of the array.
Strings: Since strings have lengths just like arrays (they’re arrays of characters), we can represent them as boxes, too.
Setting things up
As in Part 1 of this series, we need to initialize a few global variables and import mtr-accessor.js.
You might notice a few times in this script where we specify mgraphics.relative_coords. In relative mode (mgraphics.relative_coords = 1) the coordinates of the drawing area are relative to the center of the jsui display and x- and y-coordinates are in the range of -1 to 1. Simply put, this means that you don’t need to worry about the pixel size of the display and jsui will do the scaling math for you. Most of our drawing code uses the relative mode. We’ll explain more about relative and non-relative coordinates as we go through this tutorial.
autowatch = 1;
inlets = 1;
outlets = 0;

var mtr = require("mtr-accessor");

var myMtr;             // holder object for the dictionary contents
var is_loaded = false; // track whether a valid dictionary has been received
var show_info = true;  // whether to show text info

// Scaling the jsui window
var dmin = 0;  // minimum numeric value to graph
var dmax = 0;  // maximum numeric value to graph
var dext = 0;  // maximum duration value to graph
var dlen = 0;  // maximum size of array value length

// Set up mgraphics system
mgraphics.init();
mgraphics.relative_coords = 1;
refresh();
Reading the data
We will store the mtr data the same way we did in Part 1. Recall that when we construct the myMtr object we need to pass in the type of data we’re using. This is because the JavaScript Dict object in js and jsui have slightly different structures than a JavaScript object you’d get in a Node4Max environment. If you were to use Node4Max, you would want to pass in an “object” argument. Since we’re using jsui here, however, we pass in the “dict” argument.
We’ll also use a few helpful functions available from mtr-accessor.js so we can appropriately scale the window size for jsui when we get to the drawing function.
myMtr.getLen()gives us the length of the track in msmtMtr.getMax()gives the size of the largest value across all tracksmyMtr.getMin()gives the size of the smallest value across all tracksmyMtr.getMaxArr()gives the size of the largest array across all tracks
The length of the track will be used to scale the window horizontally, and the minimum and maximum values will be used for scaling vertically.
function dictionary(v) {
    var d = new Dict(v);

    // Get all the info we need from the dictionary. For
    // the min, max and ext, we move it to the next largest value
    myMtr = new mtr.Mtr(d, "dict");

    dlen = Math.ceil(myMtr.getLen());
    dmax = Math.max(myMtr.getMax(), 1);
    dmin = Math.min(myMtr.getMin(), -1);
    dext = Math.max(myMtr.getMaxArr(), 1);

    // We want the min and max to be centered around
    // the vertical center of the display, so we use
    // the largest of the min-max value for scaling
    if (Math.abs(dmin) <= Math.abs(dmax)) {
        dmax = Math.ceil(Math.abs(dmax));
        dmin = dmax * -1;
    } else {
        dmax = Math.ceil(Math.abs(dmin));
        dmin = dmax * -1;
    }
    // refresh the display
    is_loaded = true;
    refresh();
}
Utility functions
There are some small utility functions we will need to set up before we begin drawing.
In our Max patch, we’ll want to set up a toggle and message so that we can turn info text on and off.

To handle that, we’ll create a small function that will change the boolean flag show_info.
function showinfo(v) {
    show_info = v == 1;
    refresh();
}
We want the jsui window to be able to handle window resizing. On resizing, we’ll simply refresh the drawing.
function onresize(w, h) {
    refresh();
}
onresize.local = 1; // private
Finally, we’re going to need to know the aspect ratio of the window (the ratio of width to height) for relative coordinate mode.
function calcAspect() {
    var width = this.box.rect[2] - this.box.rect[0];
    var height = this.box.rect[3] - this.box.rect[1];
    return width / height;
}
calcAspect.local = 1;
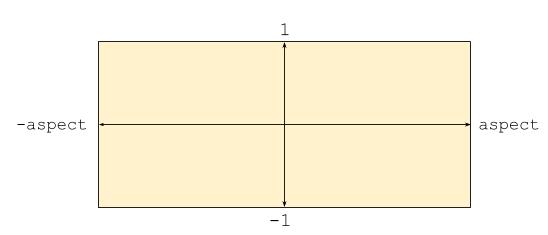
Calculating and knowing the aspect ratio allows us to consider the coordinate system like the following diagram:

Paint and refresh routines
Now for the meat of our script: the paint function.
We first set up the local drawing variables for our score like t, x, y, height, and so on.
function paint() {
    var str;
    var t, x, y;
    var colorcode = 0;
    var aspect = calcAspect();
    var height = box.rect[3] - box.rect[1];
Then we set up the multipliers needed to scale the drawing to the current visible area.
    var hmult = 1;  // horizontal multiplier
    var vmult = 1;  // vertical multiplier
    if (dext > 0) {
        hmult = (2 * aspect) / dlen;
    }
    if (dmax != 0 || dmin != 0) {
        vmult = 2 / (dmax - dmin);
    }
What we’ve done here is calculate the fraction of vertical space and horizontal space to create a grid on a [-aspect, aspect] by [-1, 1] coordinate space. In other words, hmult is the horizontal grid spacing, and vmult is the vertical grid spacing. The factor of 2 is necessary since the range is from -1 to 1 (so a distance of 2).
Now we can start drawing. First we will clear the background and draw a horizontal axis through the middle of the display.
  with (mgraphics) {
      // erase the background
      rectangle(-1.0 * aspect, 1, 2.0 * aspect, 2);
      fill();

      // draw zero line - always in the middle of the display
      y = dmin * -1 * vmult - 1;
      set_source_rgb(1, 1, 1);
      move_to(-1.0 * aspect, y);
      line_to(1 * aspect, y);
      stroke();
From here, we can start iterating through the loaded dictionary, if there is one. For each track, we will designate a new drawing color.
      if (is_loaded) {
            // run through each track in the object
            for (var n = 0; n < myMtr.tracks.length; n++) {
                // set up a unique but consistent color for each of the tracks
                colorcode += 500;
                set_source_rgb(
                    (colorcode % 66) / 66,
                    (colorcode % 88) / 88,
                    (colorcode % 113) / 113
                );
Then, for each event, we find the x-coordinate first (the time value). To do this, we start with the value of accum (the “accumulated time”) from the mtr data. To make sure we move by units of the horizontal grid spacing, we multiply accum by hmult. Then to shift the origin of our plot to the left, we have to subtract out the horizontal distance, the aspect ratio.
                for (var m = 0; m < myMtr.tracks[n].length; m++) {
                    x = myMtr.tracks[n][m].accum * hmult - aspect;
As discussed earlier, we’ll need to check the data type of the event before we decide how to draw it.
t = myMtr.tracks[n][m].type === "number" ? true : false;For a number, we take the value of the event and subtract out the minimum y-value (dmin) to get the distance from the bottom of the window. Then we scale it by our vertical grid multiplier. Finally, we subtract off 1 to handle shifting the origin from the center of the screen.
                    if (t) {
                        y = (myMtr.tracks[n][m].value - dmin) * vmult - 1;
Ellipses are drawn relative to their top left bounding box, but we want the data point to be at the center of the ellipse, so we have to do a little math to shift the x-coordinate right by the radius value (0.025) and the y-coordinate down by the radius value. The final two arguments are the major and minor axis lengths, but since we’re drawing a circle, we use the diameter for both (0.05).
                        ellipse(x - 0.025, y + 0.025, 0.05, 0.05);
                        stroke();
For the rectangle case, the math is similar. The main difference is that the height of the box is the length of the array or string scaled by the maximum array size.
                    } else {
                        y = myMtr.tracks[n][m].value.length / dext;
                        rectangle(x - 0.025, y + 0.025, 0.05, y);
                        stroke();
                    }
                }
            }
Once the data itself is plotted, we can go on to writing the info text on the bottom of the display (if it is turned on). We do this using relative coordinate mode turned off simply because it’s easier to draw text with show_str() using the absolute pixel coordinate system.
           if (show_info) {
                str = "Length: " + dlen + "  Domain: +/- " + dmax;

                // turn off relative coordinate system for this
                // function - just makes it easier!
                relative_coords = 0;

                // set up the color and font
                set_source_rgb(1, 1, 1);
                select_font_face("Ariel");
                set_font_size(9);

                // draw the text in the bottom left corner
                move_to(2, height - 2);
                show_text(str);

                // turn the relative coordinate system back on
                // for the next iteration!
                relative_coords = 1;
            }
Finally, we have to handle the case where no dictionary is loaded. In this situation, we can simply write that there is no dictionary loaded, again turning relative coordinates off for ease of plotting.
        } else {
            // no dictionary is loaded, so do a simple display

            if (show_info) {
                str = "No dictionary loaded...";

                // the same procedure as above...
                relative_coords = 0;

                set_source_rgb(1, 1, 1);
                select_font_face("Ariel");
                set_font_size(9);
                move_to(2, height - 2);
                show_text(str);

                relative_coords = 1;
            }
        }
    }
}
What’s next?
Now that you’ve seen the power of using js and jsui with mtr, you’re ready to start experimenting. For more fun, try using Node for Max with your mtr data!
by Isabel Kaspriskie on December 8, 2020

