F_Dos
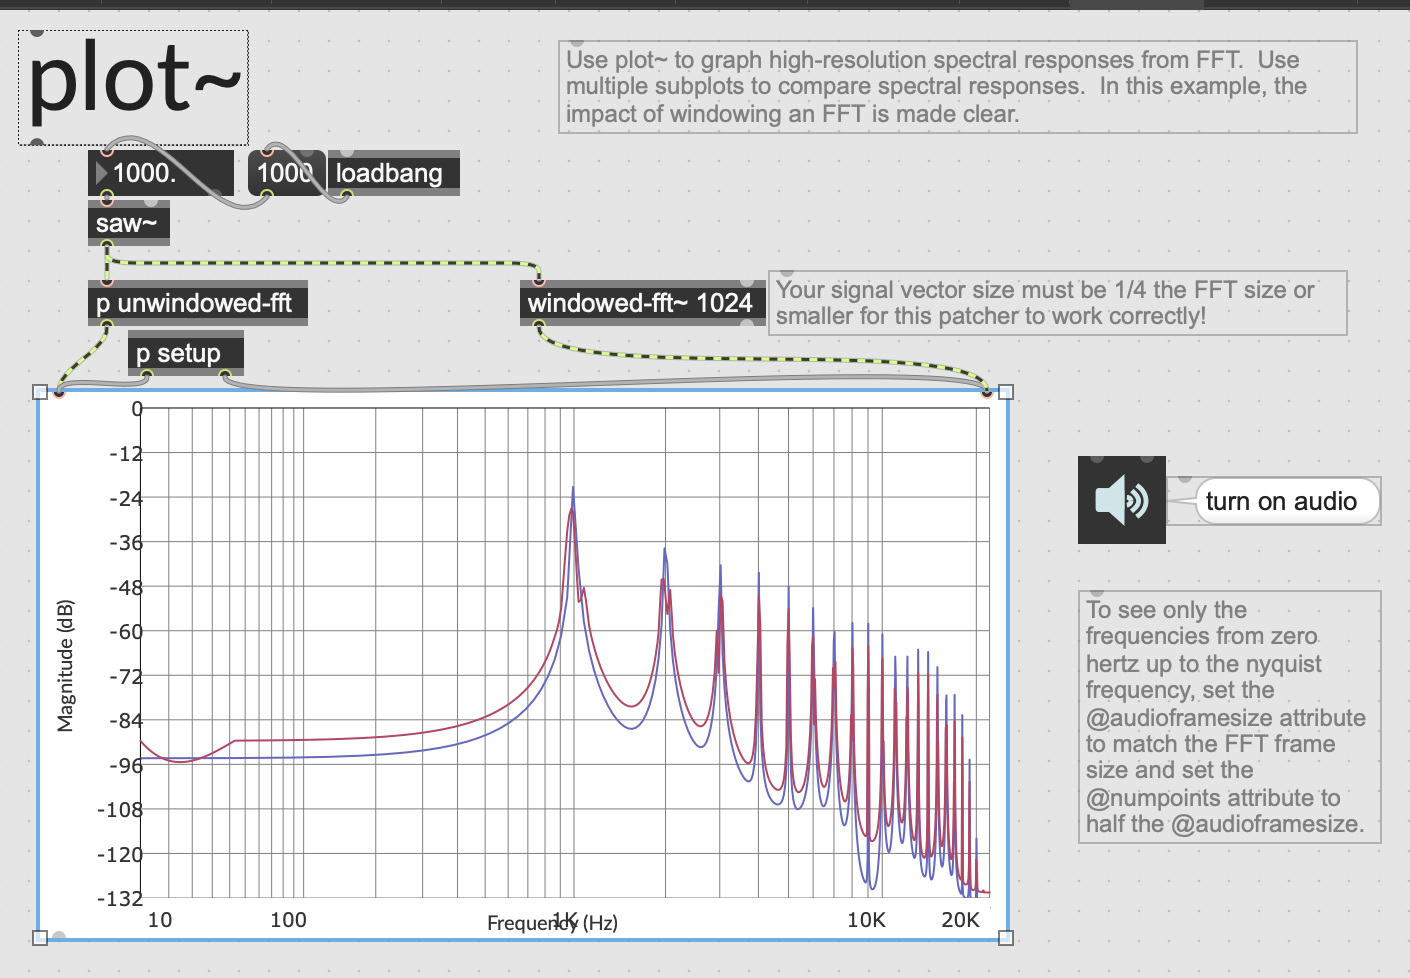
Is it possible to change the way the frequency are spread at the x axis?Also - what is the blue and red lines? why I need both to display the energy at different frequencies of a waveform ?
double_UG
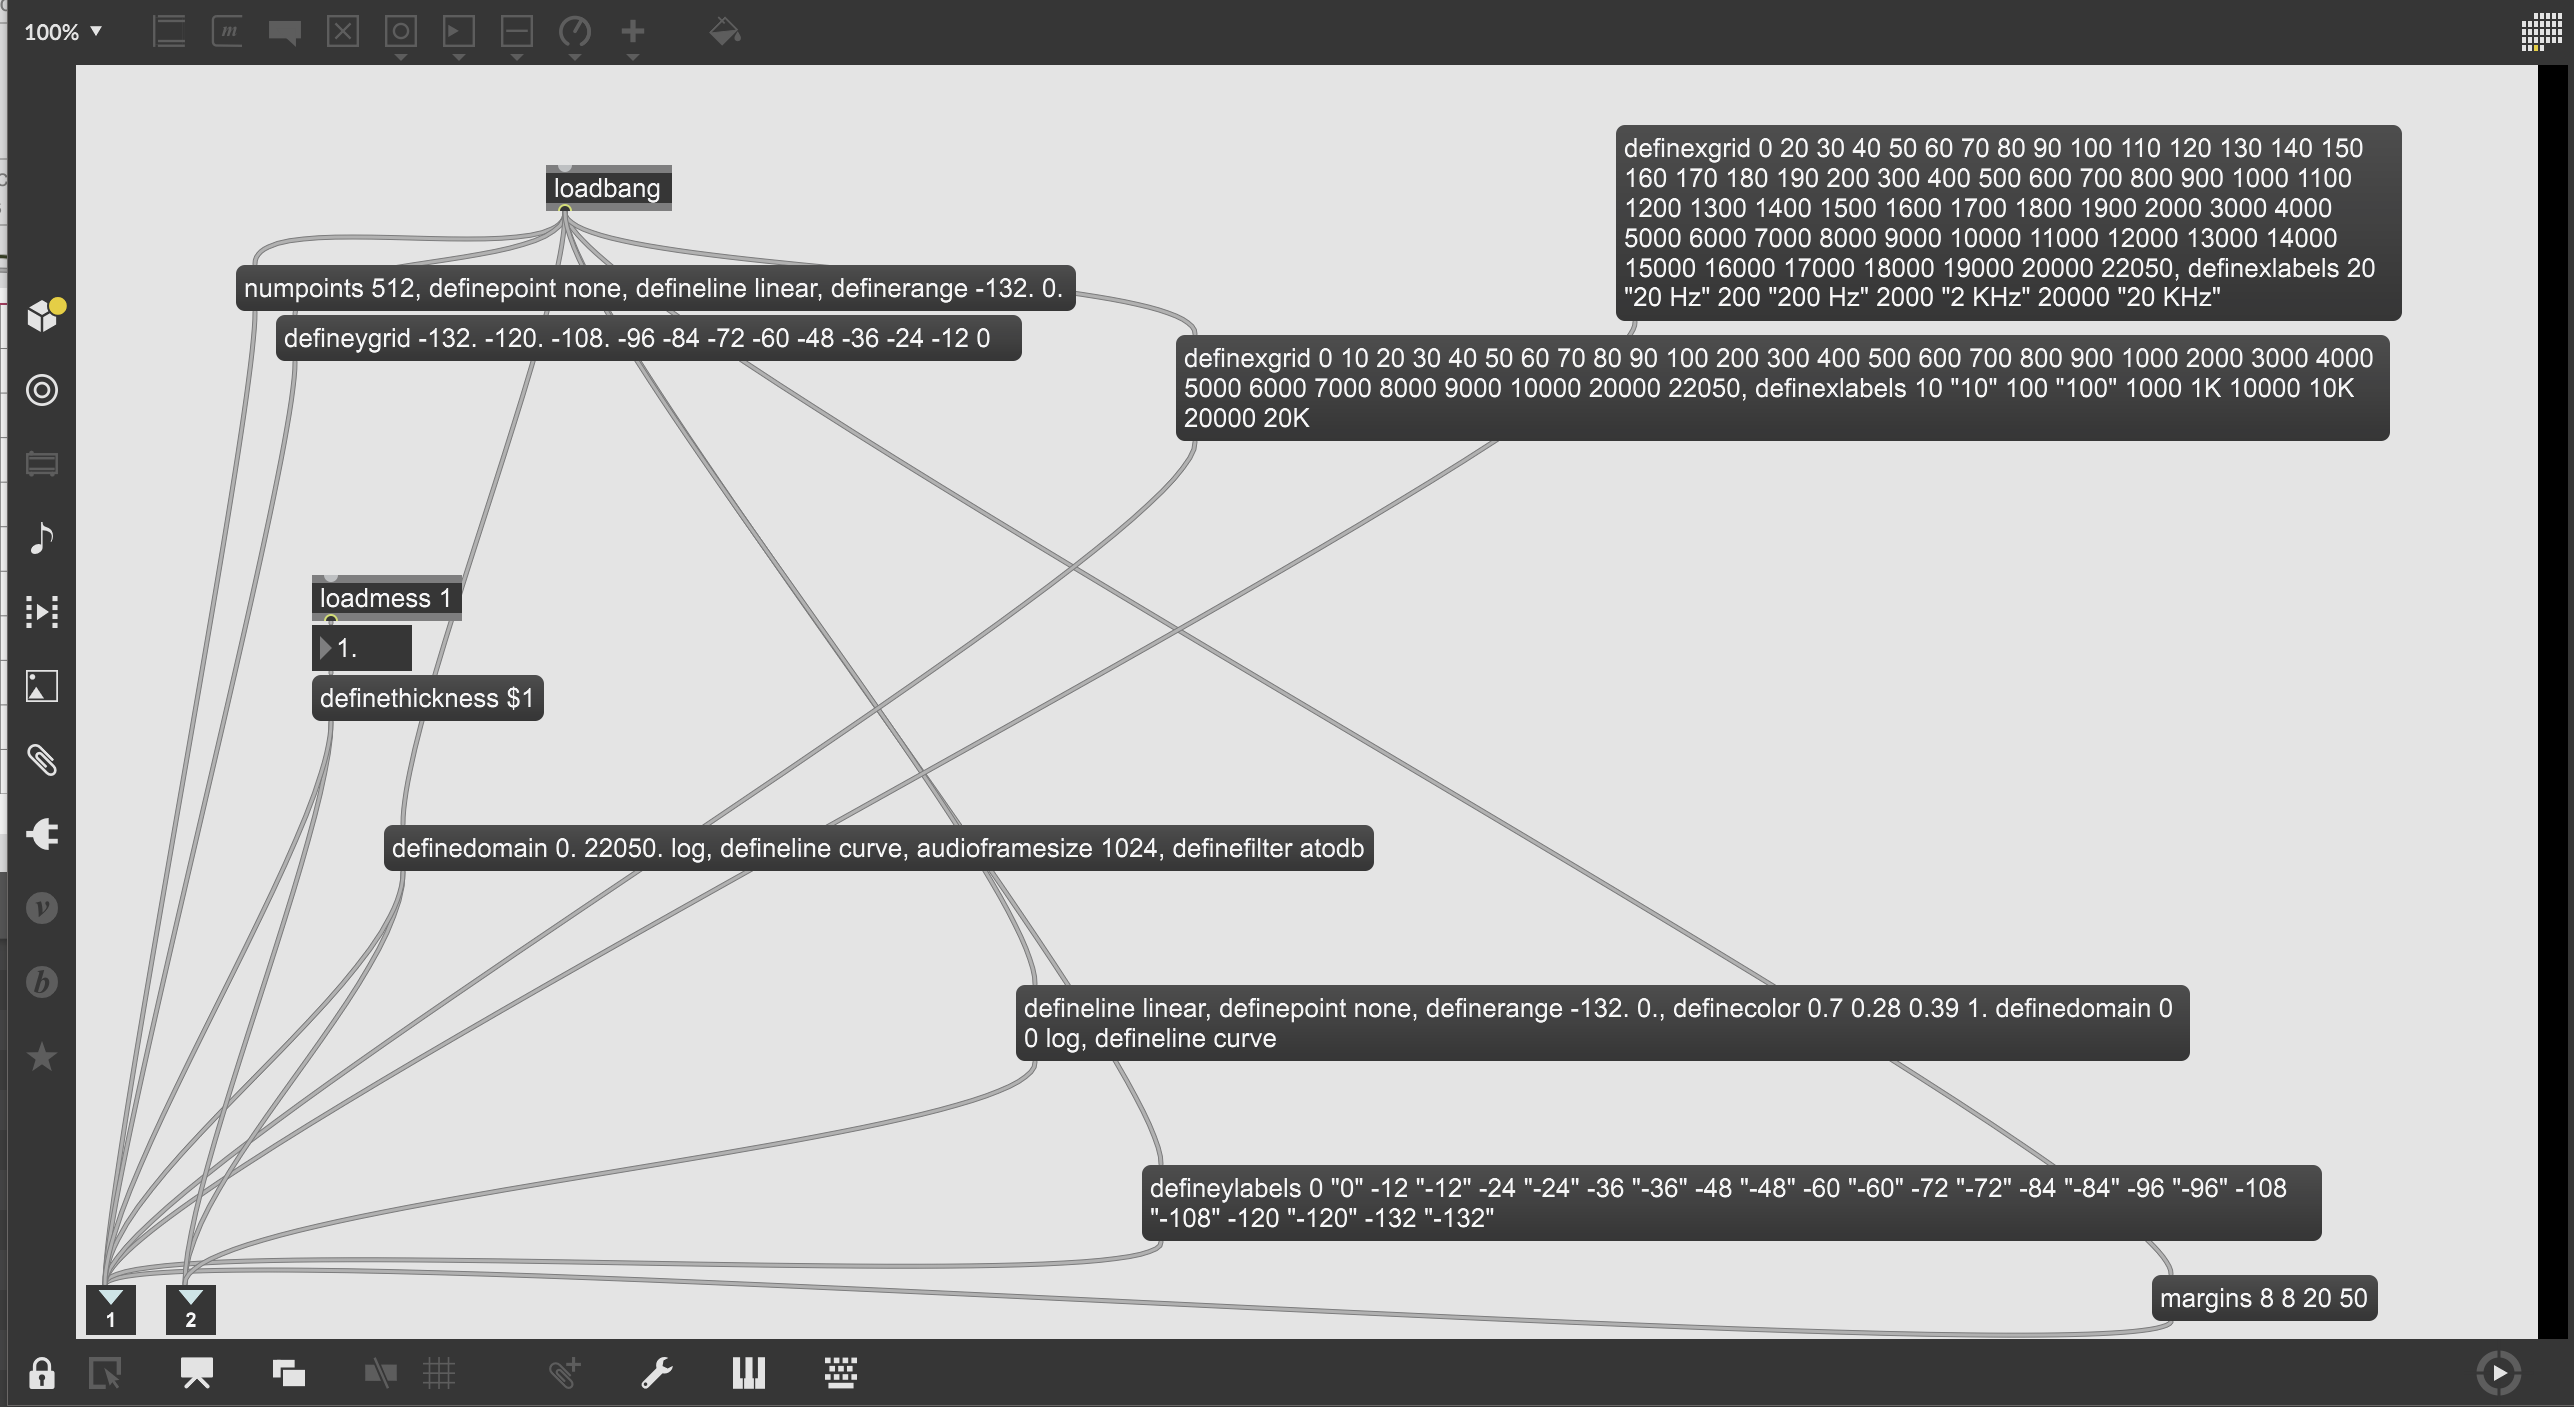
open "p setup" > definexgrid message