
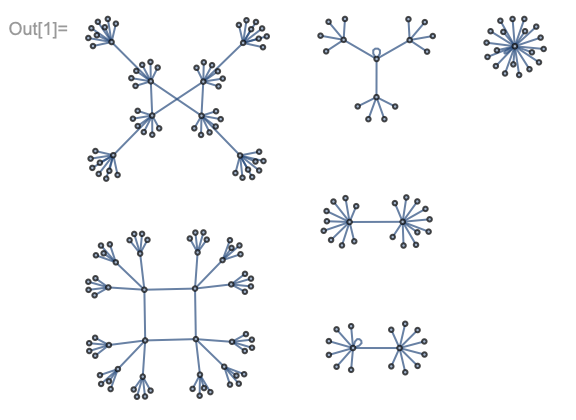
Directed Graph / Tree plot / Adjacency Matrix with Jitter

Hello, is there a simple way to achieve directed or undirected graphs with Jitter? I mean working with jit.gl.mesh @draw_mode lines and using an index array does not seem to allow to make graphs like these without specifying multiple vertices at the same location.
Is there a way to define an adjacency matrix https://reference.wolfram.com/language/ref/AdjacencyMatrix.html ?
Has anybody worked with geometry shaders and can tell me if this might be a way to create such graphs?
I am looking for an efficient method that can draw thousands of vertices and from my experience javascript is not sufficiently performant.

i don't see why a jit.gl.mesh with an index matrix won't work to produce graphs like these (other than the curved lines). so i'm not entirely sure what you're asking, but here's a basic example of using an index matrix to draw graphs:
Hi Rob,
...to make graphs like these without specifying multiple vertices at the same location.
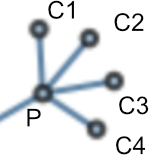
If there is a parent node P in the graph that spreads to many different other nodes Cx I would have to specify multiple vertices at the position of the parent node in order to have a pair of vertices for each line with the @draw_mode lines approach.
e.g. for the example above I would have to specify (P1,C1), (P2,C2), (P3,C3), (P4,C4) with P1,P2,P3,P4 at the same position.
I am interested in if there is an easy method that allows for specification of such a graph using only one vertex for P.
The canonical method in computer science is using an adjacency matrix, but I am not sure how to render this in Jitter. Intention is to use this with very big graphs consisting of thousands of vertices. So getting rid of multiple vertices covering the same position will also be a question of rendering performance.
hi Martin, please check the patch i posted again. unless i'm missing something it does what you need (allows you to specify multiple drawing primitives sharing vertices without having to duplicate vertices). the patch takes a 25 dim vertex matrix and uses that to draw 100 lines via the index matrix of dim 200.
if i'm misunderstanding your needs please elaborate how.
Ahh misunderstanding was on my side.
It got clear when I used a jit.cellbock for index definition.
Finally to achieve the example from above one has to specify P,C1,P,C2,P,C3,P,C4 in the index array where P addresses the same single vertex in the vertex array.