
Jitter c external debugging

Hi,
I am trying to write an jitter external for Max 9 with Max 8.2 SDK. I have the problem that Max does crash when i use my external in a patch and i do not really know why?
So is there a way to debug the external?
Or is it possible to write some information from the jitter object or wrapper to the max console with a print method or something similar?
Or are there any log files where i can find some information about the reason for crashing max?
ok, i found the post() method for writing in the max console
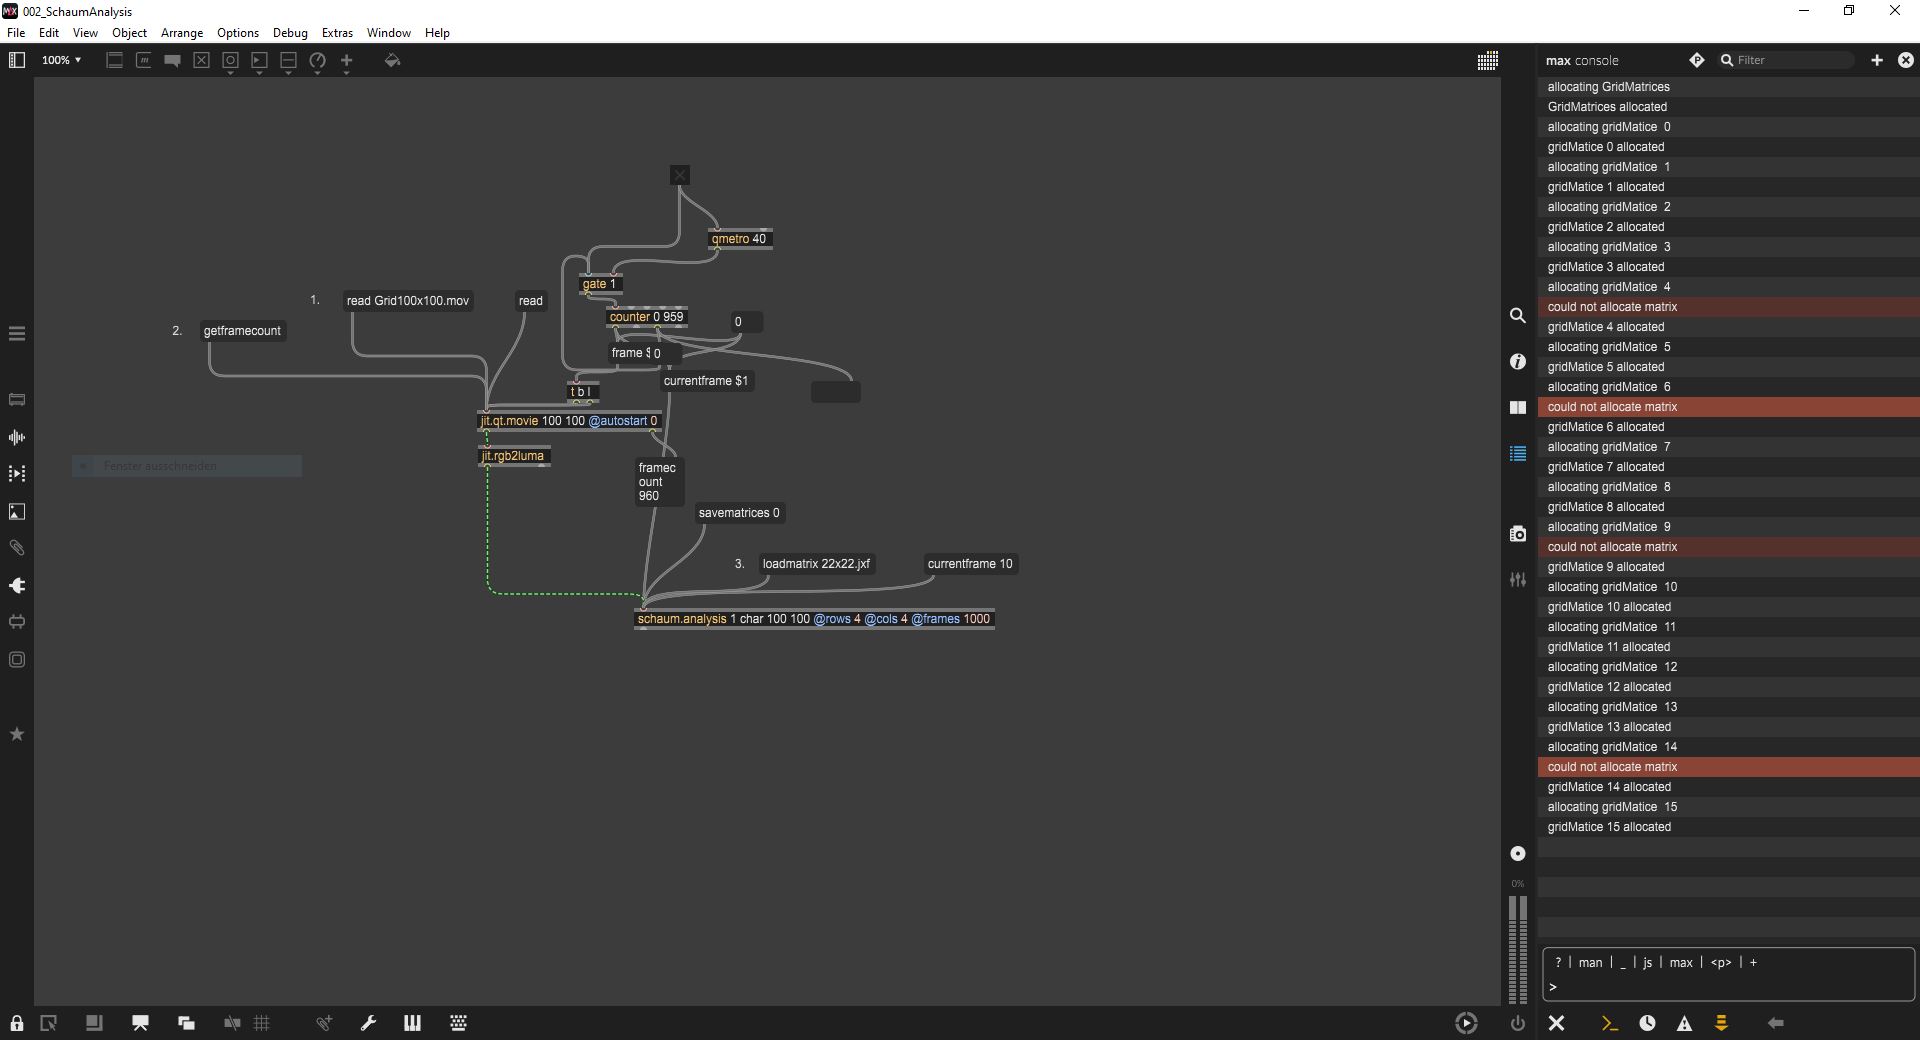
I have tried to determine what is causing the troubles in my Jitter external with writing post messages to limit the area where problems occour. It seems that the problem occours arbitrary. When i call the schaum_analysis_loadmatrix method in the schaum.analysis external from my Patch at the part:
post("allocating gridMatice %ld", i);
x->gridMatrices[i] = jit_object_new(_jit_sym_jit_matrix, &info);
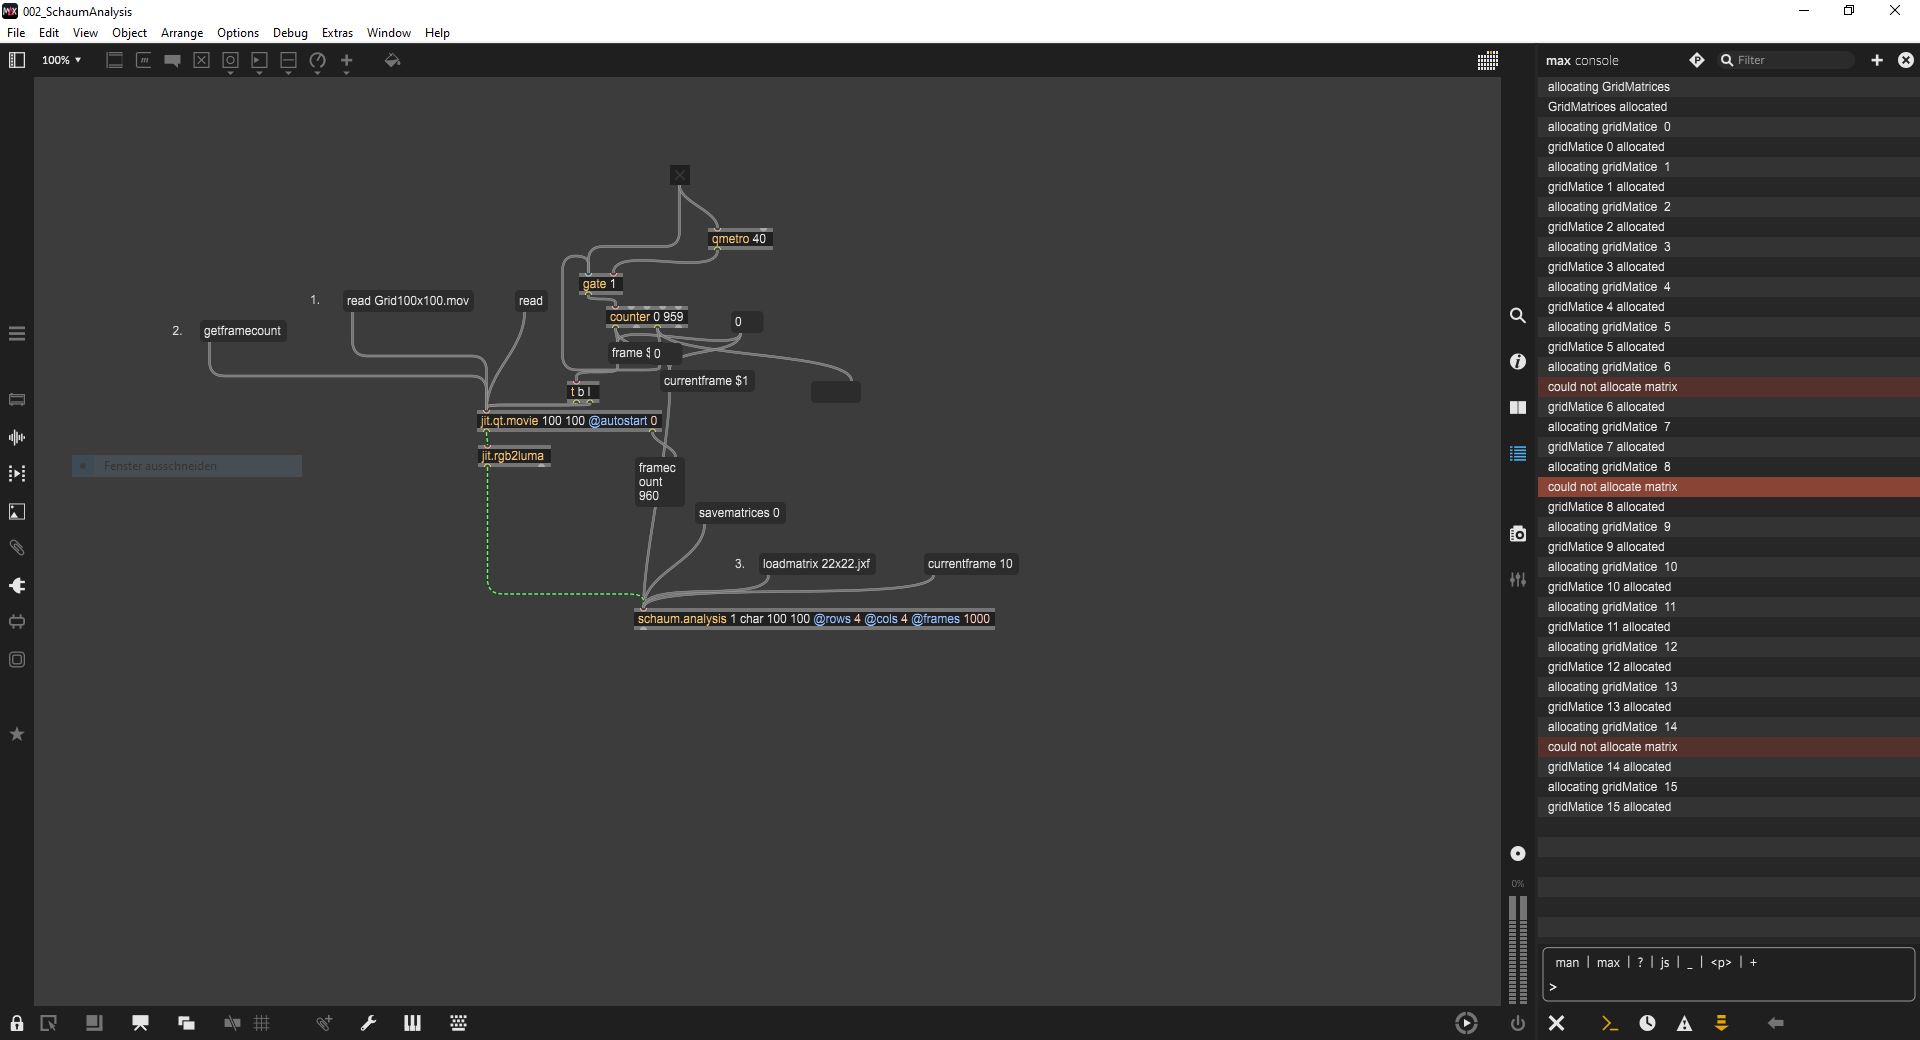
post("gridMatice %ld allocated", i);sometimes it triggers the "could not allocate matrix" message in the Max Console. But even i use the same initial situation every time i get different results at different i values:
and a second result with the same setting:
My schaum_analysis_loadmatrix method does look like:
t_jit_err schaum_analysis_loadmatrix(t_schaum_analysis* x, t_symbol* s) {
    t_filehandle fh;
    char name[MAX_FILENAME_CHARS];
    t_jit_matrix_info cell_minfo;
    short pathId;
    long * cell_bp, typePtr = 'JIT!', i, xPos, yPos;
    ulong version;
    long filesize, x1, y1, x2, y2, xCellPos, yCellPos, width, height;
    t_jit_matrix_info info;
    long* cellp;

    initMatrix(x);
    version = JIT_BIN_VERSION_1;
    x->nrOfCells = x->rows * x->cols;

    if (0 == open_dialog(name, &pathId, &typePtr, NULL, 0)) {
        path_opensysfile(name, pathId, &fh, READ_PERM);
        if (jit_bin_read_header(fh, &version, &filesize)) {
            error("jit.matrix: improper file format %s", name);
            sysfile_close(fh);
            goto out;
        }
        if (jit_bin_read_matrix(fh, x->cellMatrix)) {
            error("could not read matrix");
            sysfile_close(fh);
            goto out;
        }
        sysfile_close(fh);

        jit_object_method(x->cellMatrix, _jit_sym_getinfo, &cell_minfo);
        jit_object_method(x->cellMatrix, _jit_sym_getdata, &cell_bp);
        post("allocating GridMatrices");
        x->gridMatrices = malloc(sizeof(void*) * x->nrOfCells);
        post("GridMatrices allocated");
        for (i = 0; i < x->nrOfCells; i++) {
            yCellPos = i / x->cols;
            xCellPos = i % x->cols;

            cellp = cell_bp + yCellPos * (&cell_minfo)->dimstride[1] + xCellPos * sizeof(long) * 4;
            x1 = cellp[0];
            y1 = cellp[1];
            x2 = cellp[2];
            y2 = cellp[3];

            width = x2 - x1;
            height = y2 - y1;

            jit_matrix_info_default(&info);
            info.planecount = 1;
            info.dimcount = 3;
            info.dim[0] = width;
            info.dim[1] = height;
            info.dim[2] = x->frames;
            info.type = _jit_sym_char;
            post("allocating gridMatice  %ld", i);
            x->gridMatrices[i] = jit_object_new(_jit_sym_jit_matrix, &info);
            post("gridMatice %ld allocated", i);
        }
    }
out:
    return JIT_ERR_NONE;
}
Does anyone have an idea what could cause the problem while allocating matrices?
And how would you proceed when the Max application crashes while using an self written c-external? How could i figure out what causes the crash in detail?

Hi,
You have two options here: to view crash logs or to attach a debugger.
From your screenshots it looks like you're on Windows, which means you can find the crash logs in the Event Viewer under Windows Logs -> Application, and then locate the relevant Max crash log.
If the information in the crash logs is insufficient, your best bet is to attach a debugger to Max. This means that you launch Max, then from the IDE you're developing your externals in attach its debugger to Max, which allows you to debug / step through the code as you normally would with a standalone application. I haven't done this in years on Windows so I'm afraid I can't help you with the details, but if you're using Visual Studio, you can find more information here
Thanks! It's helping me a lot.