
plot~ amplitude

Hello everyone.
What messages to send to the object plot ~ to see this?
thank you in advance.
The pictures I found in :
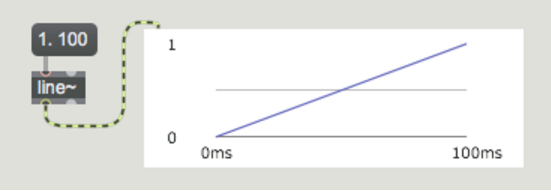
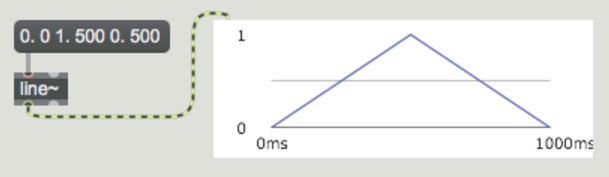
MSP Basics Tutorial 3: Wavetable Oscillator

Those pictures were probably cheats done in a graphics program, just for the purposes of demonstrating how the messages to line~ result in signal output. However, with some additional patching, it's possible to get plots like that. The plot~ object is pretty good, but — because it's designed to be able to plot many kinds of data in many ways — it does require that you specify a lot of parameters in order to get it to look the way you want, . Here's an example of how you could obtain a plot like the ones you mentioned.
Max Patch
Copy patch and select New From Clipboard in Max.