Design a table to plot the x and y position keeping them in their different unit measures.

I want to draw a point of intersection using the measure of their unit measure. This form will help a person to see a level of different time measure and hieght of sound. This short show of table will be repeated for a dozen of samples.
And if possible, edit the lyrics of that song. It's meant to show the up and down to a learner.
I tried the multislider object, but the x axis is alway fixed. I appreciated any suggestion to solve the issue.
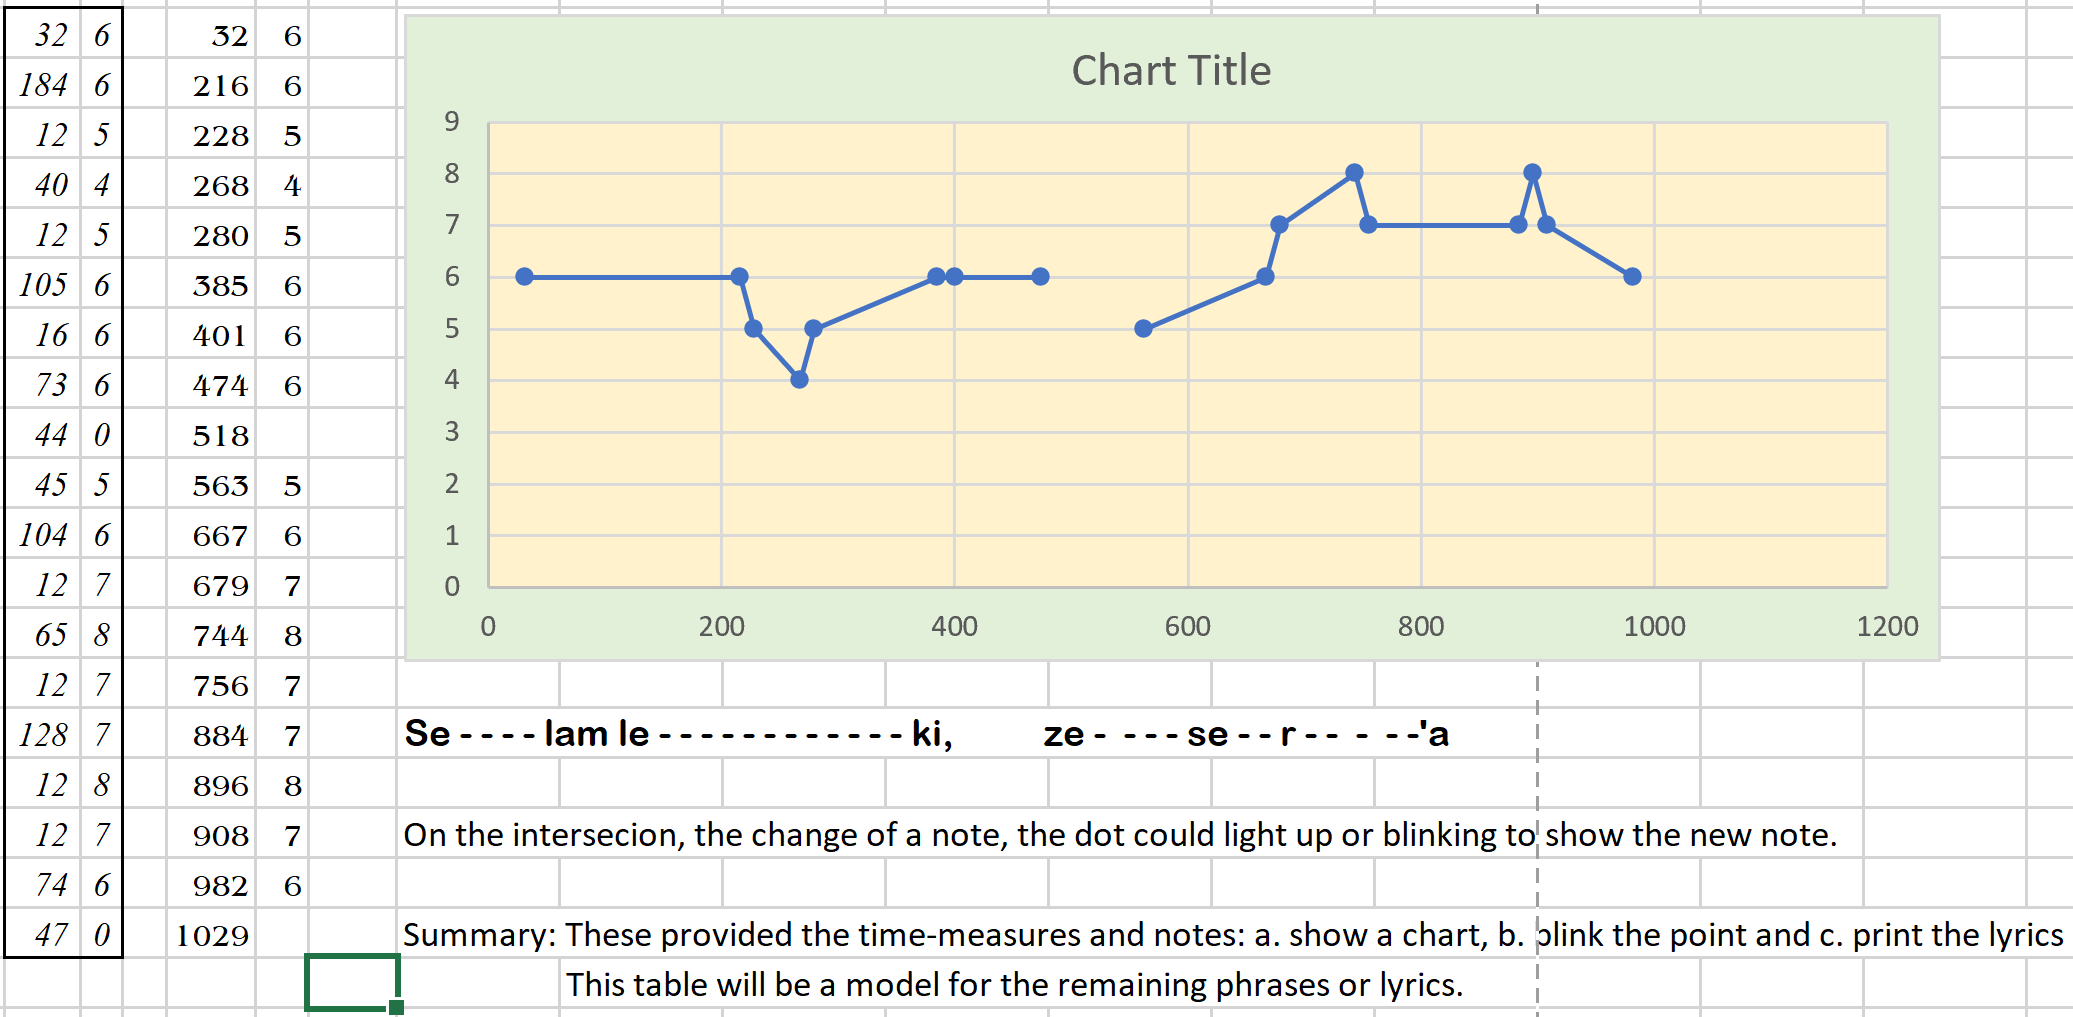
The pair "x & y" data I use looks like this: "32 6 184 6 12 5 40 4 12 5 105 6 16 6 73 6 44 0 45 5 104 6 12 7 65 8 12 7 128 7 12 8 12 7 74 6 47 0"

what exactly do you want to see ?
a plot with 12 points ?
or a square with fixed size where that points scroll or something else ?
what are min/max values ?

I also got trouble to imagine what you want to achieve - maybe its a good idea to upload a (handdrawn) sketch of an example.
Just recently I dived into plot~, which might be helpful for you. Its quite versatile and it also works with Max lists and not only with audio objects - the help patcher reveals a lot of its potential.
One pitfall to keep an eye on regarding the horizontal axis : definedomain sets the value range but you also need to set numpoints accordingly as well, if you change the amount of points ploted with each visualization, sending different data-sets into plot~, or you will see old values (from the previous data set).
I will add a pic of the design, hope it helps to get to the target I want to use.
I tested the plot~ object. I see it works like the multislider, the x_axis is fixed not according the different time-line the slide wants to show.
This chart shows the singer the up and down of note and the time-measure that needs to prolong. In short it tells excactly the meaning of a note. The chosen model is for kids or people who had no info about music notes knowledge. Thanks for your patience.